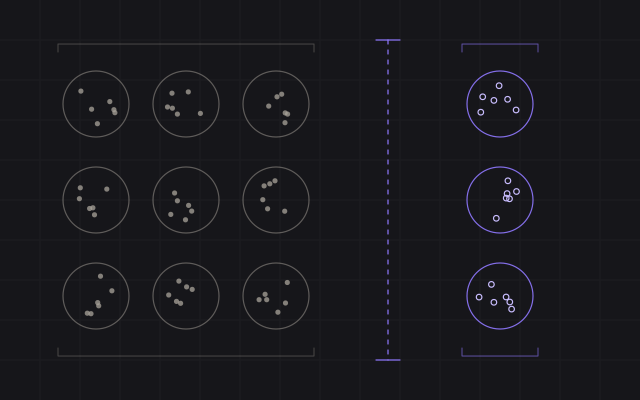
Evaluating a tissue-sensing classifier requires clear provenance, independent reference labels and tests on unseen specimens. This explainer covers how to design and report those evaluations.
Provenance: where every measurement came from
Evidence starts with a record. For every measurement, a sound dataset can say which specimen it came from and how that specimen was obtained, handled and stored; how long after excision it was measured and at what temperature; which instrument, electrodes and calibration were used; who took the measurement and under what contact conditions; and which version of the software processed it. Raw data stay unaltered, and every processing step can be rerun from them.
Each item on that list is a known source of variation in tissue impedance, as Reading tissue with impedance explains. The record shows whether a difference between two groups of measurements reflects tissue type or something that differed between the sessions in which they were taken. Work with human or animal tissue also requires the appropriate ethical approvals, and those belong in the record too.
Phantoms, ex vivo and in vivo
Phantoms, excised tissue and living tissue each support different conclusions.
What each kind of test material can and cannot show
- PhantomsEngineered materials with known, stable electrical properties, such as saline solutions and salted gels.
- Can showWhether the instrument measures correctly, repeats and stays calibrated, and how it responds to controlled changes.
- Cannot showWhether real tissues can be told apart. Most phantoms lack cell structure unless they are built specifically to imitate it.
- Ex vivo tissueTissue measured after removal from the body.
- Can showReal cell structure under controlled conditions, with reference labels from histology of the measured site.
- Cannot showBehavior in living tissue. Excised tissue changes with time, lacks blood flow and is often at a different temperature.Reference 1 In vivo and ex vivo properties can differ.Reference 2
- In vivoMeasurements in living tissue, in animal studies or, with the required approvals, in people.
- Can showBehavior with blood flow, body temperature, motion, bleeding and realistic contact.
- Cannot showFrom animals alone, how a system performs in people, because species differ. That comes only from properly approved clinical studies in the intended setting.
Each material answers a different experimental question. Choose the test material and conditions to match the question and development stage.
Reference labels
A classifier learns whatever its labels say, including their mistakes. Labels therefore need a reference standard that is independent of the sensor: for tissue type, usually histology of the measured site, or careful identification by experienced specialists with documentation. Three details determine label quality.
- Same place. The label must describe the tissue the current actually passed through, not a structure nearby. At boundaries, where nerve meets fat or a vessel meets connective tissue, the measured volume may be mixed, and the labeling scheme has to allow for that.
- Blinded. Whoever assigns the reference label should not see the sensor output, and the reverse.
- Consistent. When labels depend on judgment, agreement between labelers should be checked and reported.
STARD 2015, a reporting guideline for diagnostic accuracy studies, asks authors to describe the reference standard and the rationale for choosing it, and to state what information was available to those assessing it.Reference 3
Split by specimen, not by measurement
Most datasets hold many measurements from each specimen. Those measurements are not independent: they share the specimen’s temperature, hydration, handling and quirks. Shuffle individual measurements into training and test sets and the same specimen lands on both sides. A model can then score well by recognizing a specimen it has already seen, without learning anything general about tissue type.
a Split by measurement: leaks
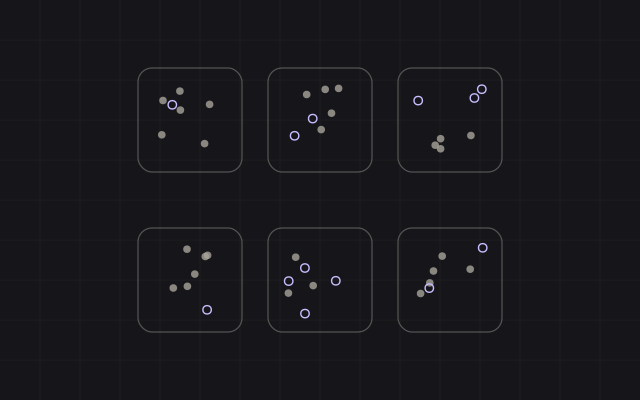
b Split by specimen
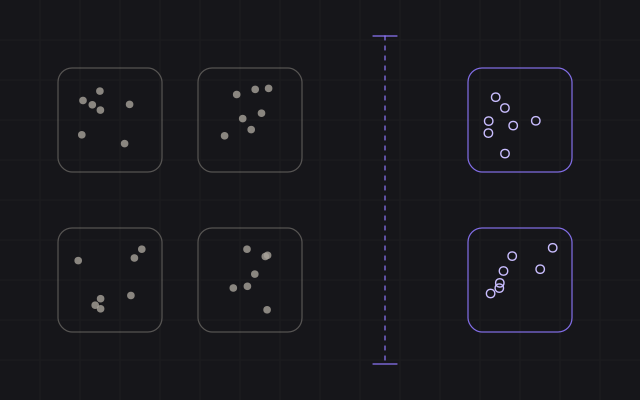
- Training measurement
- Evaluation measurement
- One specimen
- Held-out boundary
This is one form of data leakage, and it is common. Kapoor and Narayanan surveyed machine-learning-based science and found leakage reported in hundreds of papers across seventeen fields, in some cases producing badly overoptimistic conclusions.Reference 4
The remedy is to split at the level of whatever will be new when the system is used. For tissue sensing that means at least the specimen, and usually the animal or donor, since specimens from one source share its characteristics. All tuning and model selection happen inside the training data, with the same grouping respected. The held-out test set is set aside at the start and used once, at the end.
Reporting classifier performance
Complete reporting goes beyond a single accuracy figure. Imagine a test set in which nine of every ten measurements come from muscle. A model that always answers “muscle” is right nine times out of ten, and useless for finding anything else. Context changes what any single number means.
- Per-class results. How often each tissue type is identified correctly, and what it is mistaken for, usually shown as a confusion matrix.
- Trade-offs. Sensitivity and specificity move in opposite directions as a decision threshold changes. The chosen operating point should follow from the intended use.
- Uncertainty. Results from a limited number of specimens carry wide uncertainty. Confidence intervals should be calculated at the level of independent units, specimens or donors, not individual measurements.
- Failures. Which specimens and conditions the model gets wrong, and whether those errors cluster, often says more than the average does.
Calibrated outputs
Many classifiers report a probability alongside a label. A well-calibrated probability matches observed frequency. For example, among samples assigned a nerve probability of 0.8, roughly eight in ten should actually be nerve tissue. A model can rank cases well and still be badly calibrated, most often by being overconfident. Van Calster and colleagues call calibration the Achilles heel of predictive analytics and argue that poorly calibrated models can mislead decisions.Reference 5 Calibration is checked on held-out data, and checked again whenever the setting changes: a model calibrated on excised tissue need not stay calibrated on living tissue.
Observed frequency against predicted probability
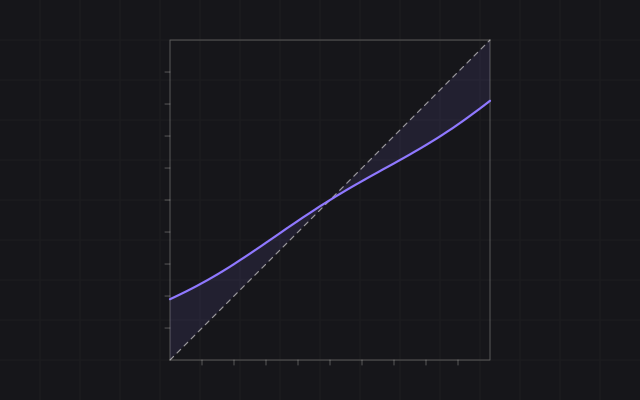
- Perfect calibration
- A hypothetical overconfident model
- Miscalibration
Intended use and the person reading the output
Evidence is always evidence for something. An evaluation is defined by its intended use: which procedure, which tissues, which decision the output supports, who reads it and under what conditions, and what happens when it is wrong, uncertain or unavailable. A system evaluated on large, clean ex vivo samples has not been evaluated on small structures in a wet field.
The output also has to be understood by a person working under time pressure. Human-factors evaluation asks whether users interpret the output correctly, whether it fits the flow of the procedure, and whether “no reliable reading” comes across as clearly as a confident answer.
Reporting guidance
Two published guidelines set out what a complete report should contain. STARD 2015 lists 30 essential items for reporting diagnostic accuracy studies.Reference 3 TRIPOD+AI, published in 2024, provides a 27-item checklist for studies that develop or evaluate prediction models, whether they use regression or machine learning.Reference 6 Both help authors include the details a reader needs to judge a study.
In practice
Applying these methods
These principles guide study design and reporting. Clinical relevance is established through evaluation in the intended setting.
References
Haemmerich D, Ozkan R, Tungjitkusolmun S, et al. Changes in electrical resistivity of swine liver after occlusion and postmortem. Medical & Biological Engineering & Computing. 2002;40(1):29–33. doi:10.1007/BF02347692 · PMID 11954705
O’Rourke AP, Lazebnik M, Bertram JM, et al. Dielectric properties of human normal, malignant and cirrhotic liver tissue: in vivo and ex vivo measurements from 0.5 to 20 GHz using a precision open-ended coaxial probe. Physics in Medicine and Biology. 2007;52(15):4707–4719. doi:10.1088/0031-9155/52/15/022 · PMID 17634659
Bossuyt PM, Reitsma JB, Bruns DE, et al. STARD 2015: an updated list of essential items for reporting diagnostic accuracy studies. BMJ. 2015;351:h5527. doi:10.1136/bmj.h5527 · PMID 26511519
Kapoor S, Narayanan A. Leakage and the reproducibility crisis in machine-learning-based science. Patterns. 2023;4(9):100804. doi:10.1016/j.patter.2023.100804 · PMID 37720327
Van Calster B, McLernon DJ, van Smeden M, et al. Calibration: the Achilles heel of predictive analytics. BMC Medicine. 2019;17(1):230. doi:10.1186/s12916-019-1466-7 · PMID 31842878
Collins GS, Moons KGM, Dhiman P, et al. TRIPOD+AI statement: updated guidance for reporting clinical prediction models that use regression or machine learning methods. BMJ. 2024;385:e078378. doi:10.1136/bmj-2023-078378 · PMID 38626948

